Schematics don’t speak text—they speak graphics!
- protowoerk
- Jan 29, 2025
- 1 min read
In software development, tools like Git have become the gold standard for version control, offering seamless tracking of text-based file changes. But in hardware development, things are a bit more complex. Tracking changes in schematics or PCB layouts isn’t straightforward—coordinates, line positions, new components, and nets don’t translate well into a simple git diff.
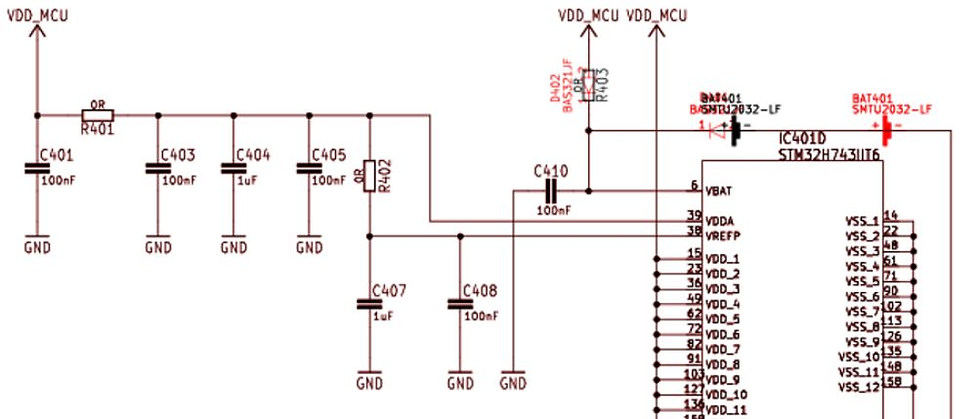
That’s where visual comparison comes in. As we prepare the second iteration of a design for production, we use tools like KiCad's CLI to generate visual plots of the schematics. By comparing the current workspace with a specific commit, we overlay changes into a single image—new elements highlighted in red make revisions instantly recognizable.
This process is not only efficient but also highly effective. Applying it across all schematic sheets and including these visuals in release files ensures a clear and intuitive way to track and review changes. It streamlines the entire review process, enabling us to deliver designs with confidence and precision.


Comments